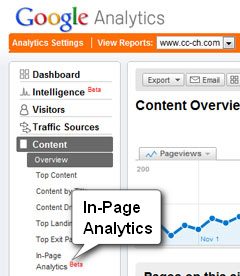
You'll find In-Page Analysis under the Content section.
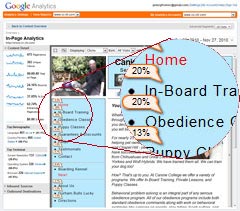
When you click the In-Page Analysis link you’ll be taken to a page that shows your website within Google Analytics. You’ll have a column on the left with lots of handy stats for the page you’re looking at. Even better, you’ll see a little bubble by every link on your site showing what percentage of clicks were on that link.

When you first start this feature up you’ll see your site’s homepage. Look at the link stats. Since every website is different and has different objectives it’s hard to give universal advice about what your numbers should ideally look like. Think about what path you want visitors to take through your site and see if the numbers match your ideal. If not, make a note of the issue.
After you look at the homepage, click one of your links and have a look at the next page. Consider where you’d like visitors to go after that page and see if your click statistics match up. While you explore, pay attention to the Entrance and Exit percentages in the left column as well. A high exit percentage on your Contact page is normal. On your homepage, it’s a problem.
You can explore your whole site this way, and I suggest you do. It never fails to amaze me how quickly I can find actionable information this way.
I expect Google will be improving the In-Page Analysis feature a lot as time goes on. Perhaps eventually they’ll even give us click heat maps showing exactly where clicks happen, down to the pixel. Of course, by then you’ll be a pro with this feature because you started using it religiously after reading this, right?
Note: If you have the kind of website that you log into as an administrator, you may need to log out before this feature will work correctly.